Bollinger Bands, Moving Average & MACD Strategy | 66% Monthly Profits😍
At first glance, achieving a 66% monthly return using an indicator-based trading strategy might sound far-fetched. However, the combination of Bollinger Bands, Moving Averages, and MACD has proven that it’s entirely possible. This strategy brings together the strengths of these three popular indicators to create a precise, data-driven system that minimizes false signals and maximizes profitability.
The synergy between them is what makes this approach so powerful. Bollinger Bands help identify volatility and potential breakout zones, the Moving Average filters market noise and confirms trend direction, while the MACD highlights momentum shifts with impeccable timing. When used together, they form a strategy that’s both technically solid and surprisingly beginner-friendly — even for those developing automated trading bots. In short, this method blends simplicity with performance, delivering consistent and reliable signals that traders can confidently act on.
Tools Required for the Bollinger Bands, Moving Average, and MACD Strategy
For this strategy, you will need the following three indicators:
-
Bollinger Bands indicator with a period of 15
-
Simple Moving Average indicator with a period of 26
-
MACD indicator with settings 1-15-6
At the end of this text, you can download the template for free and add it to your MetaTrader platform.
How to Trade Using the Bollinger Bands, Moving Average, and MACD Strategy
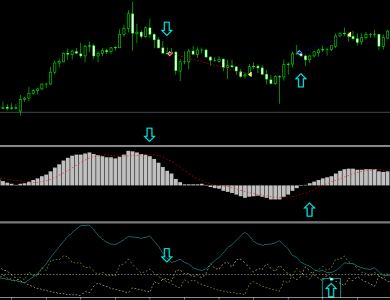
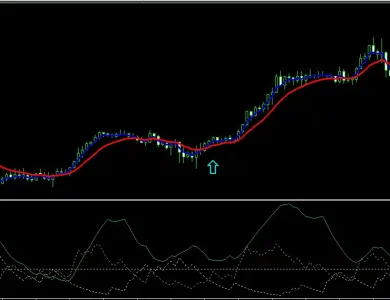
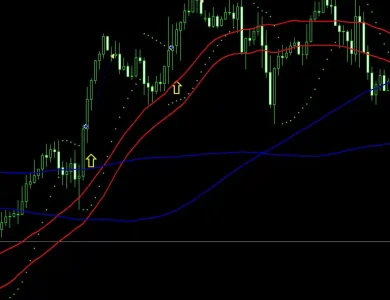
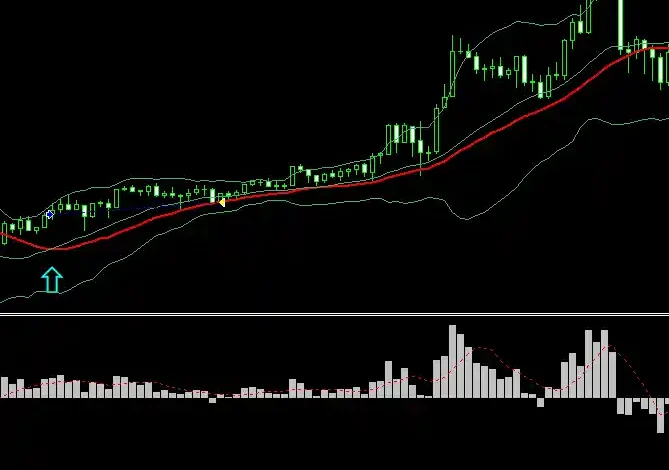
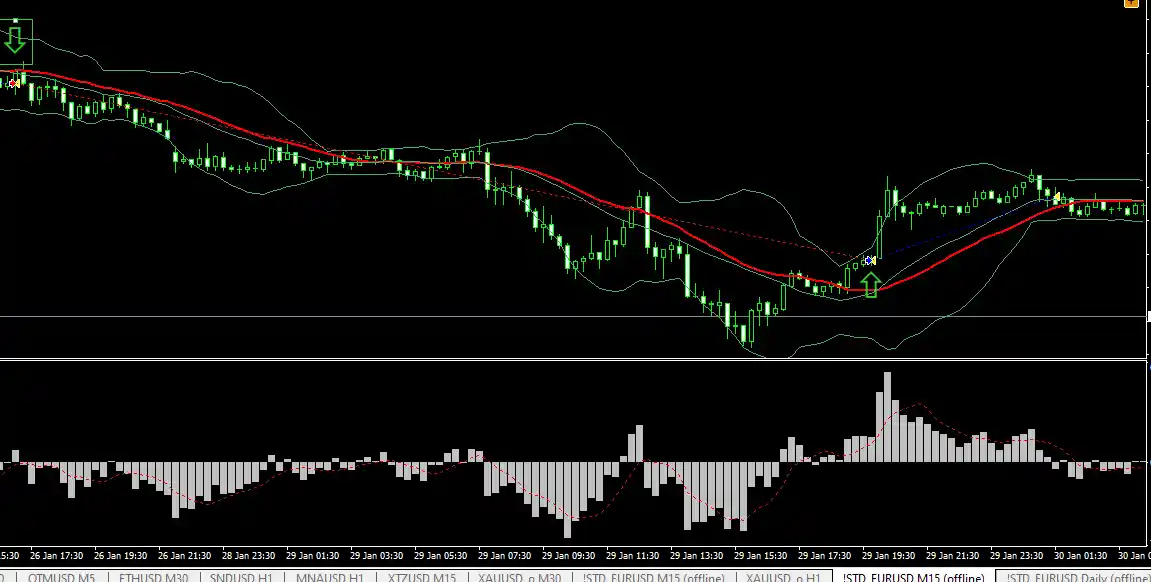
Trading with this strategy doesn’t require anything complicated — in fact, its simplicity is what makes it so effective. To get an entry signal, watch for the middle line of the Bollinger Bands to cross the Moving Average line. At the same time, make sure that both the price candles and the MACD bars are moving in the same direction as the crossover. The key is that the price should align with the direction in which the Bollinger Band’s middle line crosses the Moving Average.
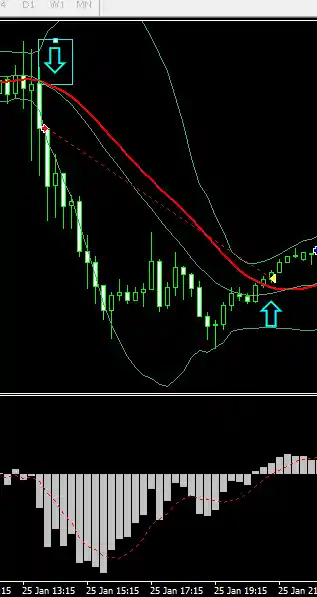
Once these conditions are met, it’s time to enter the trade. You can also wait for one or two candles to form for additional confirmation if you prefer a more cautious approach. As for exiting the trade, it’s flexible — you can adjust it based on your own trading plan. However, a smart rule of thumb is to close the position whenever you notice signs of trend weakness or suspect a potential price reversal. This helps protect your profits and keeps unnecessary risks at bay.
Backtest Results of the Bollinger Bands, Moving Average, and MACD Strategy
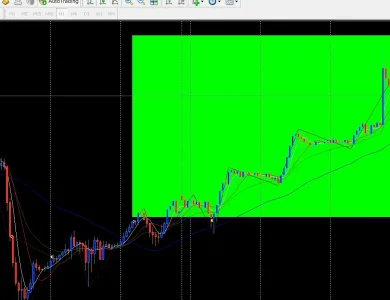
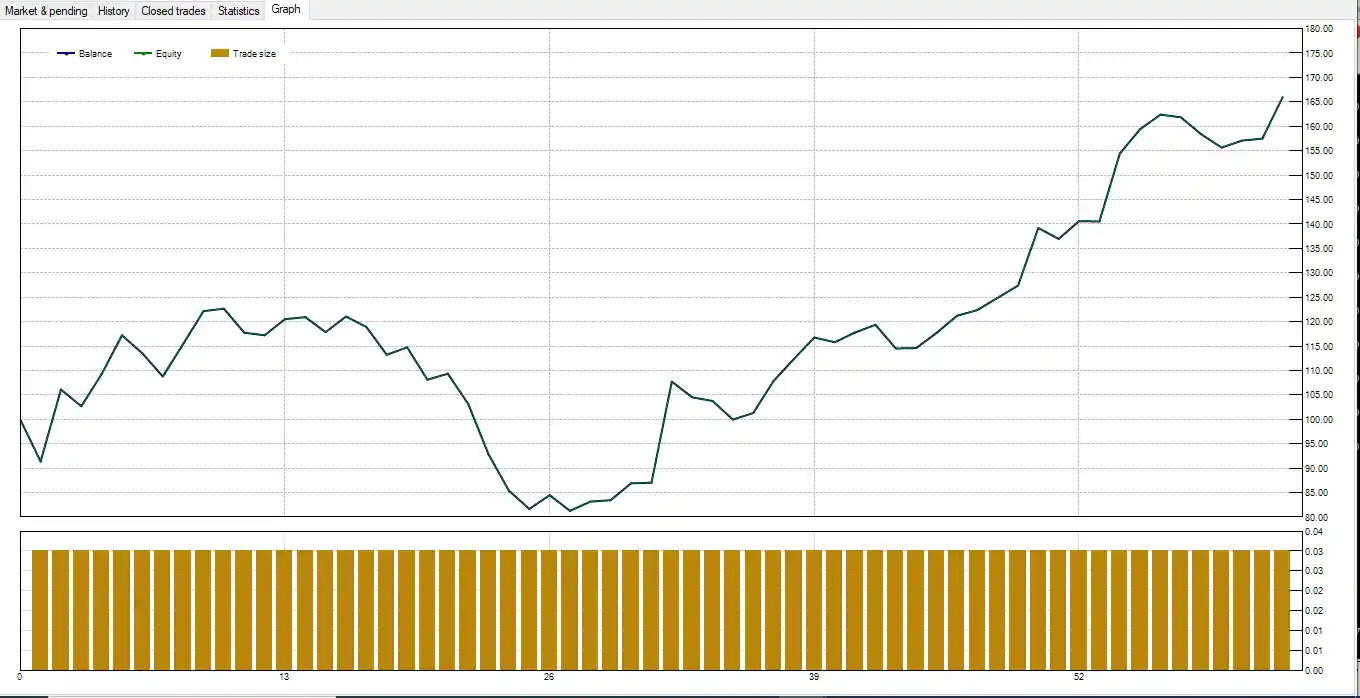
Backtesting is one of the most crucial steps we focus on at Mira Pips, as it reveals the true potential of any strategy. Many trading systems that look highly profitable on paper turn out to be unprofitable in real market conditions — and only a proper backtest can uncover that. To evaluate the performance of this combined strategy, we ran a detailed backtest in the first month of 2024, using the EUR/USD pair on the 15-minute timeframe. The results were both impressive and consistent.
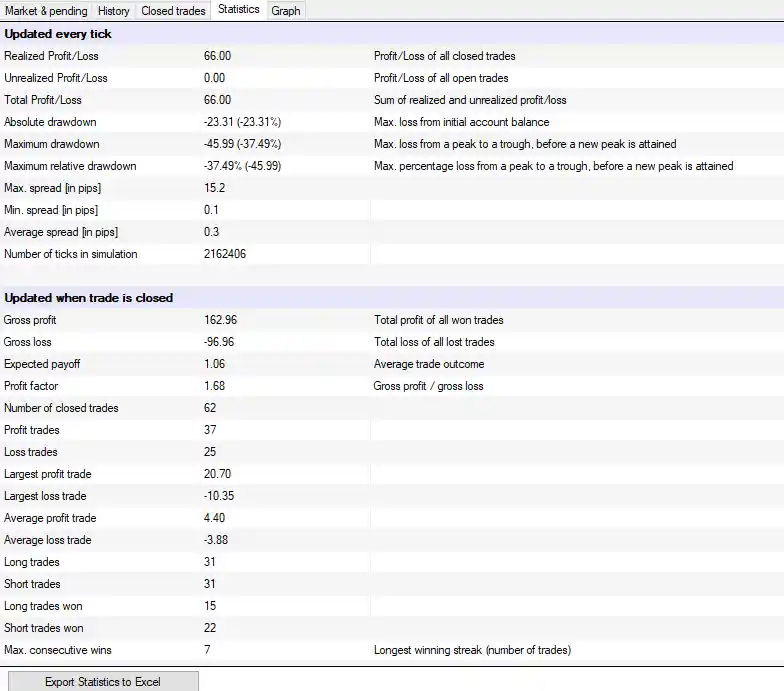
As shown in our test data, this strategy managed to achieve an astonishing 66% return in just one month, which is quite remarkable for a short-term setup. Out of 62 total trades, 37 were profitable, giving the system a win rate of around 60%. The average profit per trade was 4.4%, while the average loss stood at 3.88%, resulting in a profit-to-loss ratio of 1.13 — a clear sign of sustainable growth over time.
For the sake of simplicity, the initial capital in this test was set to $100, making the calculations for profit and loss straightforward. While the numbers may vary slightly depending on market conditions, these results highlight the strategy’s solid foundation and its potential for steady, long-term performance when applied with discipline and proper risk management.
My Opinion on the Bollinger Bands, Moving Average, and MACD Strategy
From a performance standpoint, the Bollinger Bands, Moving Average, and MACD strategy is highly effective — but it truly shines in trending markets. While the multiple confirmations built into this system help maintain profitability even in sideways or ranging conditions, its real strength appears when the market establishes a clear direction. In other words, minor losses during range-bound periods are usually offset by significant gains once a strong trend takes hold.
Personally, I consider this strategy an excellent choice for beginners, especially those interested in developing automated trading bots. The reason is simple — a bot doesn’t sleep. Even if you miss a trending move because you’re away from the charts, your automated system can continue executing trades based on your preset rules. This ensures that you never miss out on high-probability setups while keeping your emotions out of the equation.
However, I strongly advise against using this strategy on lower timeframes, as they tend to be noisy and volatile, increasing the risk of false signals and unnecessary losses. A minimum timeframe of 15 minutes is recommended for stable and reliable performance. And before going live with real funds, always spend some time testing the strategy on a demo account — it’s the safest way to gain confidence and understand how the setup behaves under different market conditions.