Moving Average and Parabolic SAR Strategy
A Simple Yet Profitable Trading System
Having a simple yet effective trading strategy is something most traders constantly seek. A while ago, a friend introduced me to a straightforward system that he claimed could be highly efficient. According to him, the beauty of this strategy lies in its multiple filters that help traders avoid unnecessary losses during sideways or choppy market conditions. After a quick review, I decided it was worth sharing. This approach is designed as a swing trading system—meaning it can be quite dynamic at times—but it truly shines when applied in trending markets, where clear directional movement offers high-profit potential.
The Moving Average and Parabolic SAR Strategy combines the strengths of two powerful technical indicators to create a balanced, trend-following setup. It utilizes six indicators in total, with the Moving Averages providing a broader view of trend direction, while the Parabolic SAR fine-tunes entry and exit points with precision. This combination allows traders to stay in profitable trades longer while minimizing exposure during uncertain conditions. It’s a versatile strategy that appeals to both novice and experienced traders looking for clarity and consistency in their trading decisions.
Chart Setup for the Moving Average and Parabolic SAR Strategy
This strategy requires a total of five indicators, four of which are Moving Averages. Each plays a unique role in identifying market direction and potential entry points. Setting them up correctly on your chart is essential for achieving accurate signals and maintaining consistency in your trades.
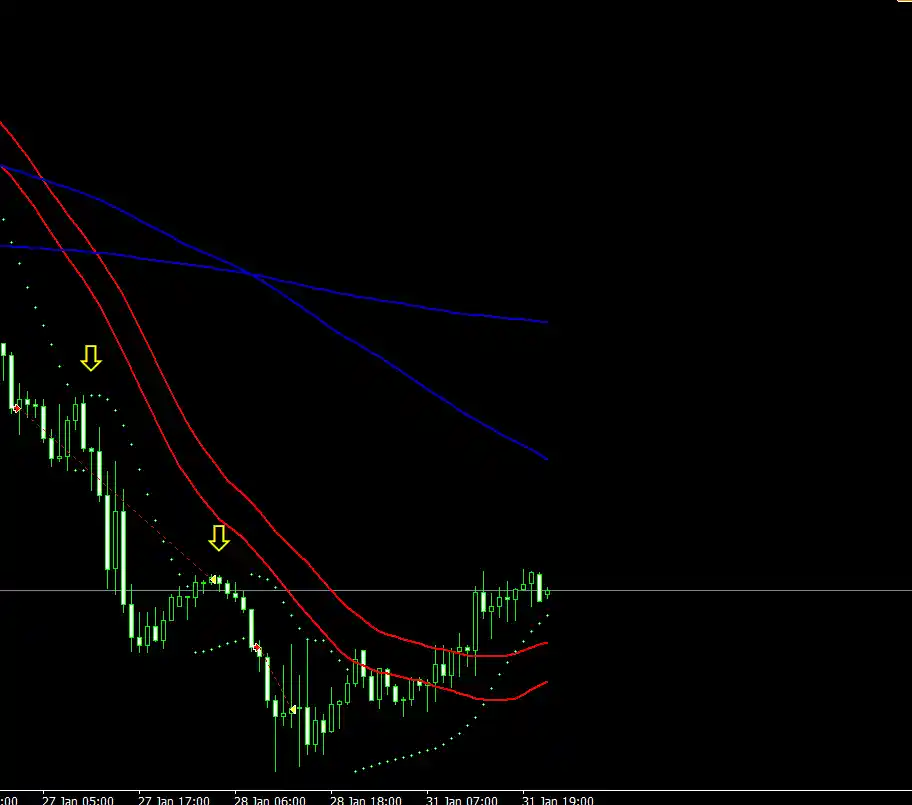
Chart Setup
Start by adding two Simple Moving Averages (SMA 32) to your chart:
-
One should be applied to the High prices of each candle.
-
The other should be applied to the Low prices.
These two lines form a dynamic price channel often referred to as the Channel Moving Average. This channel acts as a visual guide to show where price may find temporary support or resistance.
Next, add the Parabolic SAR indicator with the following settings:
-
Step = 0.02
-
Maximum = 0.2
This indicator appears as small dots above or below the candles, effectively showing the current direction of the trend. When the dots flip to the opposite side, it often signals a potential trend reversal.
For a broader market perspective, include two additional Simple Moving Averages (SMA 100 and SMA 200) applied to the Close price. These longer-term averages are optional but highly recommended, as they help you identify the overall market direction and filter out trades that go against the main trend.
Suggested Timeframes: 15-minute, 30-minute, and 1-hour charts.
Applicable Pairs: All currency pairs can be used effectively with this setup.
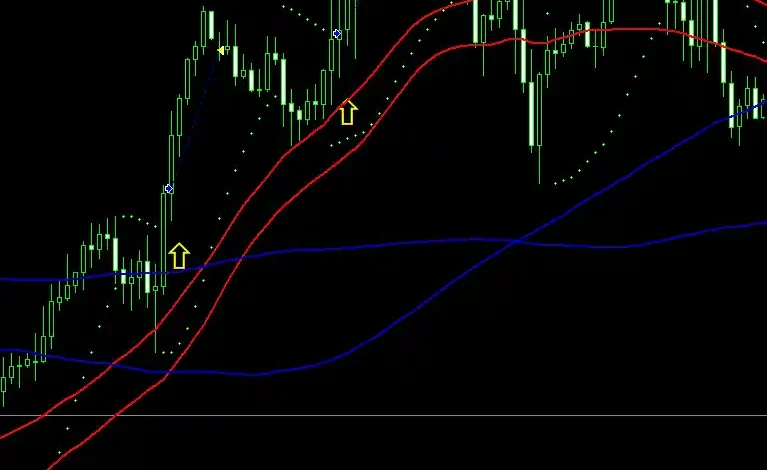
🔵 Long Entry Conditions
To open a Buy position, the following conditions must be met:
-
The closing price (Close) of the candle must be above the SMA (32) High.
→ This means the candle has broken above the Moving Average channel. -
(Optional) The price is above the SMA 100 and SMA 200, confirming an overall uptrend.
-
The candle must be bullish → closing price higher than the opening price.
-
The Parabolic SAR indicator must switch from above the candles to below them.
→ This indicates a potential upward movement.
🔴 Short Entry Conditions
To open a Sell position, the following conditions must be met:
-
The closing price (Close) of the candle must be below the SMA (32) Low.
→ This means the candle has broken below the Moving Average channel. -
(Optional) The price is below the SMA 100 and SMA 200, confirming an overall downtrend.
-
The candle must be bearish → closing price lower than the opening price.
-
The Parabolic SAR indicator must switch from below the candles to above them.
→ This signals potential downward momentum.
⚙️ Stop-Loss Setup
-
For Buy trades: place the Stop-Loss below the nearest local minimum (fractal) and under the SMA (32) Low.
-
For Sell trades: place the Stop-Loss above the nearest local maximum (fractal) and over the SMA (32) High.
🎯 Take-Profit Setup
You can use one of the following three methods to exit with profit:
-
Based on timeframe:
-
15-minute chart → around 10 pips profit
-
30-minute chart → around 13 pips profit
-
60-minute chart → around 18 pips profit
-
-
When the Parabolic SAR flips position:
→ Move your Stop-Loss to follow the new SAR point or use a Trailing Stop. -
When the price re-enters the SMA (32) channel:
→ This signals the end of the move—close the trade.
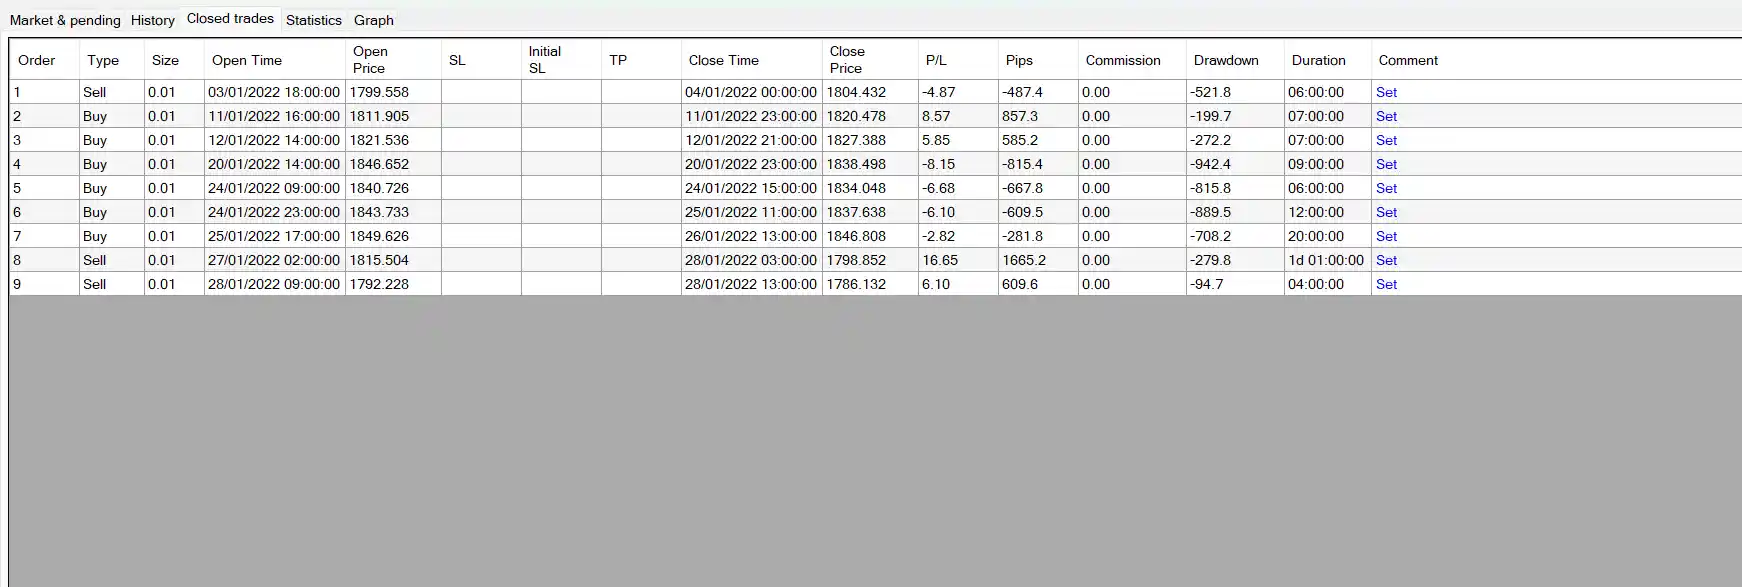
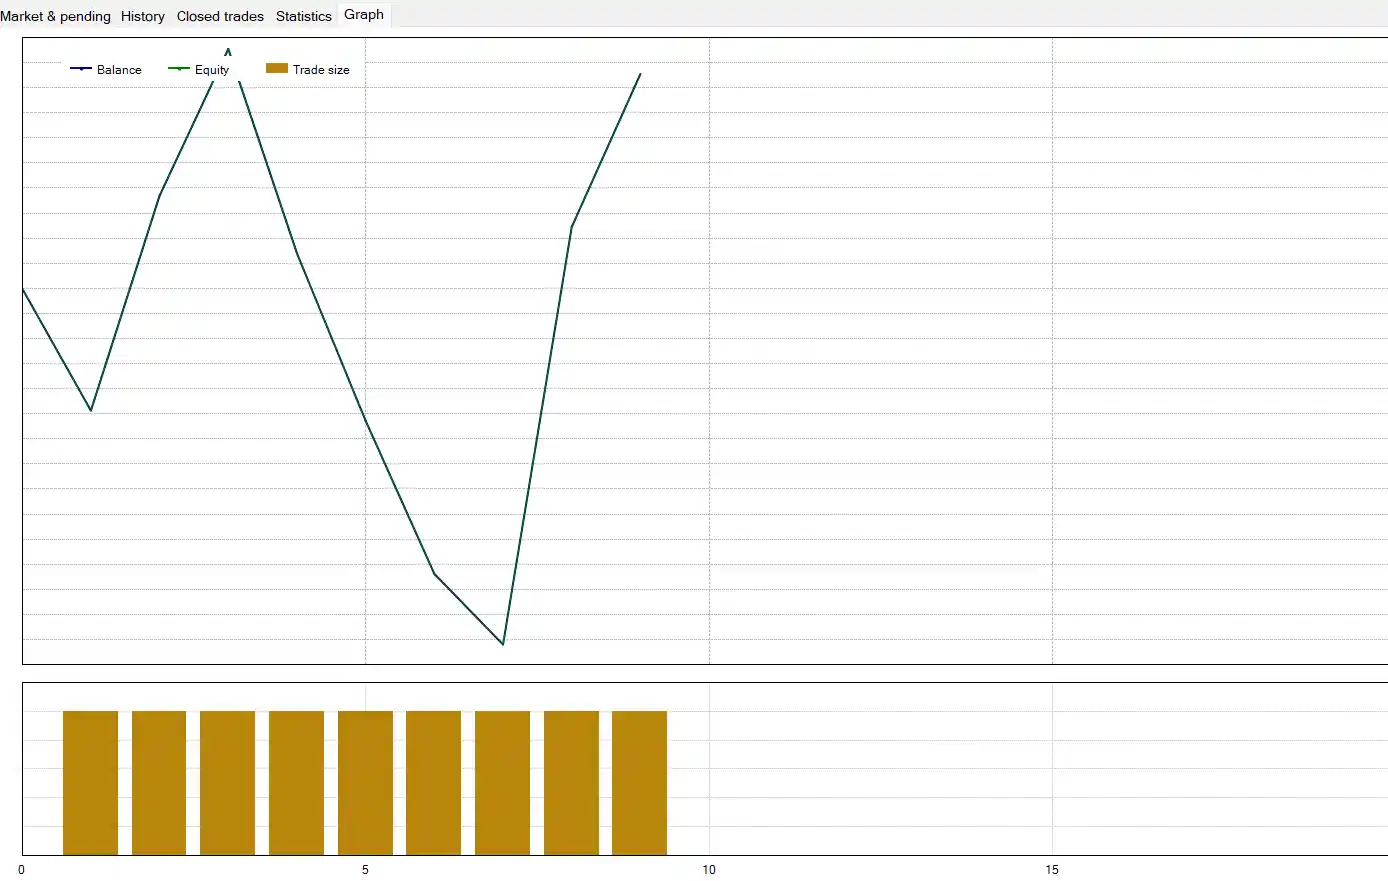
Backtest Results of the Moving Average and Parabolic SAR Strategy
I conducted a detailed backtest of this strategy to evaluate its performance and reliability. The full video of this backtest is available on my YouTube channel. The test was carried out on the 1-hour timeframe, covering the period from January 1, 2022, to January 30, 2022. Below are the summarized results of this analysis.
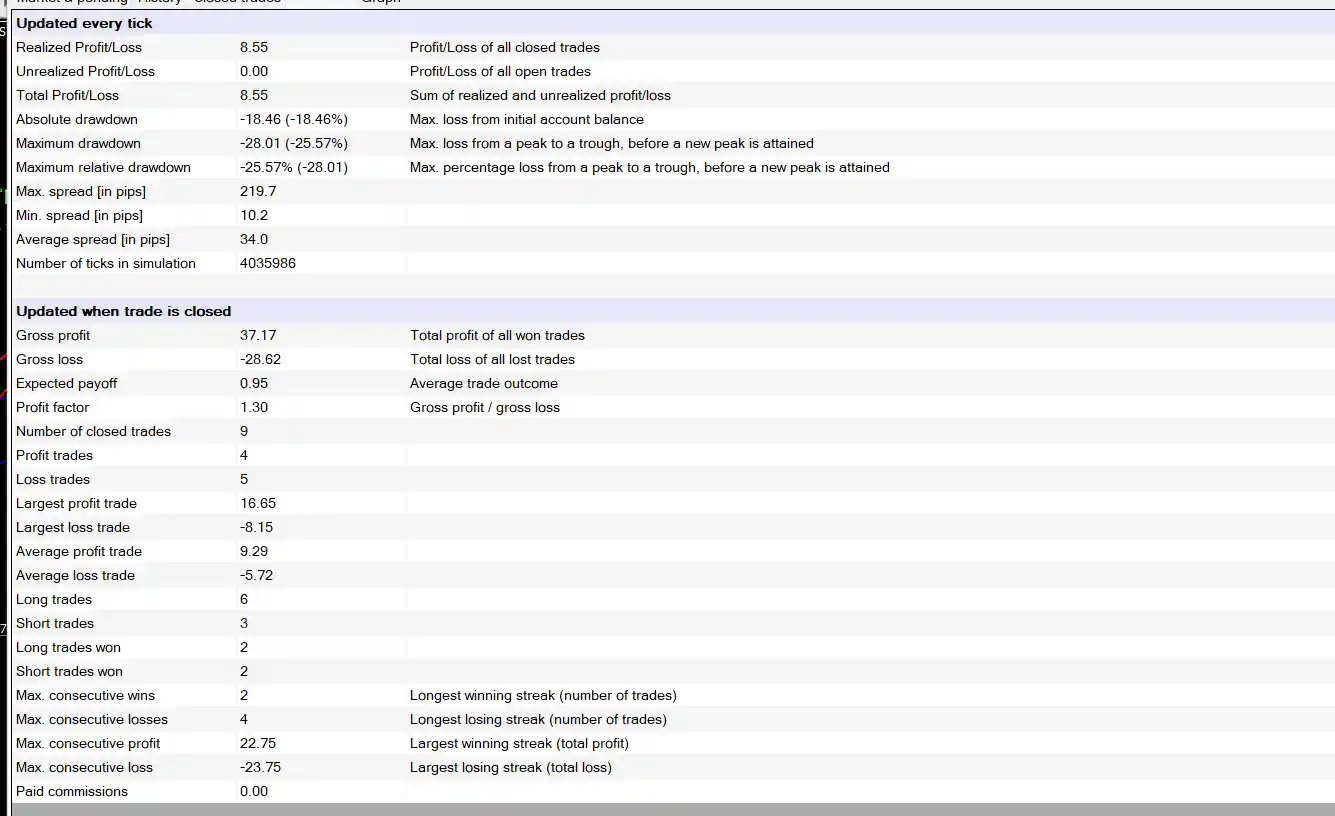
As you can see, during this testing period, the strategy achieved an overall profit of 8%, which is quite reasonable for such a simple and mechanical trading approach. The win rate stood at approximately 40%, but thanks to a risk-to-reward ratio of about 1:2, the system remained profitable — with winning trades roughly doubling the size of the losing ones. The profit factor was 1.3, which isn’t exceptionally high but still indicates a consistently positive edge over time. Overall, this backtest demonstrates that even with modest accuracy, disciplined risk management and proper trend confirmation can make this strategy a solid addition to a trader’s toolkit.
My Opinion on the Moving Average and Parabolic SAR Strategy
In my view, this strategy is quite suitable for beginner traders who are looking for a structured and easy-to-follow system. It provides clear entry and exit rules and helps new traders develop discipline in executing trades. However, the strategy can be somewhat volatile in its performance, which may not appeal to those who prefer stability and consistency. The main strength lies in its high risk-to-reward ratio, which makes it capable of generating profits even with a relatively low win rate — a valuable trait for simple trend-following systems.
That said, I believe the strategy could become significantly more effective with additional filters or confirmation tools. If traders can maintain the same risk-to-reward ratio while slightly improving the win rate, this setup could evolve into a truly reliable method. For now, it’s a decent starting point but not an ideal standalone system. With proper adjustments and experience, however, it has the potential to transform into a solid trading approach for those willing to refine it.
faq
1. Is this strategy suitable for beginners?
Yes, it’s simple and structured, making it a good choice for traders who are just starting out.
2. What is the main advantage of this strategy?
Its high risk-to-reward ratio allows traders to stay profitable even with a lower win rate.
3. What is the main weakness of this strategy?
Its performance can be inconsistent and somewhat volatile, which may reduce confidence for some traders.
4. How can this strategy be improved?
By adding more filters or confirmation signals to increase the win rate without sacrificing the risk-to-reward balance.